Are you still excelling or are you already using Power BI’? – Part 1
According to the Capterra User Study From 2019, Excel is still the number 1 software for data analysis in small and medium-sized businesses. The Microsoft software is very easy to learn, has a wide range of functions and most users already have previous knowledge. At second glance, there is especially in the area of standard reporting, these are very good reasons to finally sort out Excel and switch to Power BI.
This is the first post in our blog series on the topic of data analysis and KPIs from the areas of marketing, sales, service and commerce using Microsoft Power BI. An important part of this will also be the SAP data source. Join us on a journey through the Power BI cosmos, from first insights into existing tools to a more intensive look at use cases.

Let’s start with a common scenario that is still practiced in today’s companies on a daily basis.
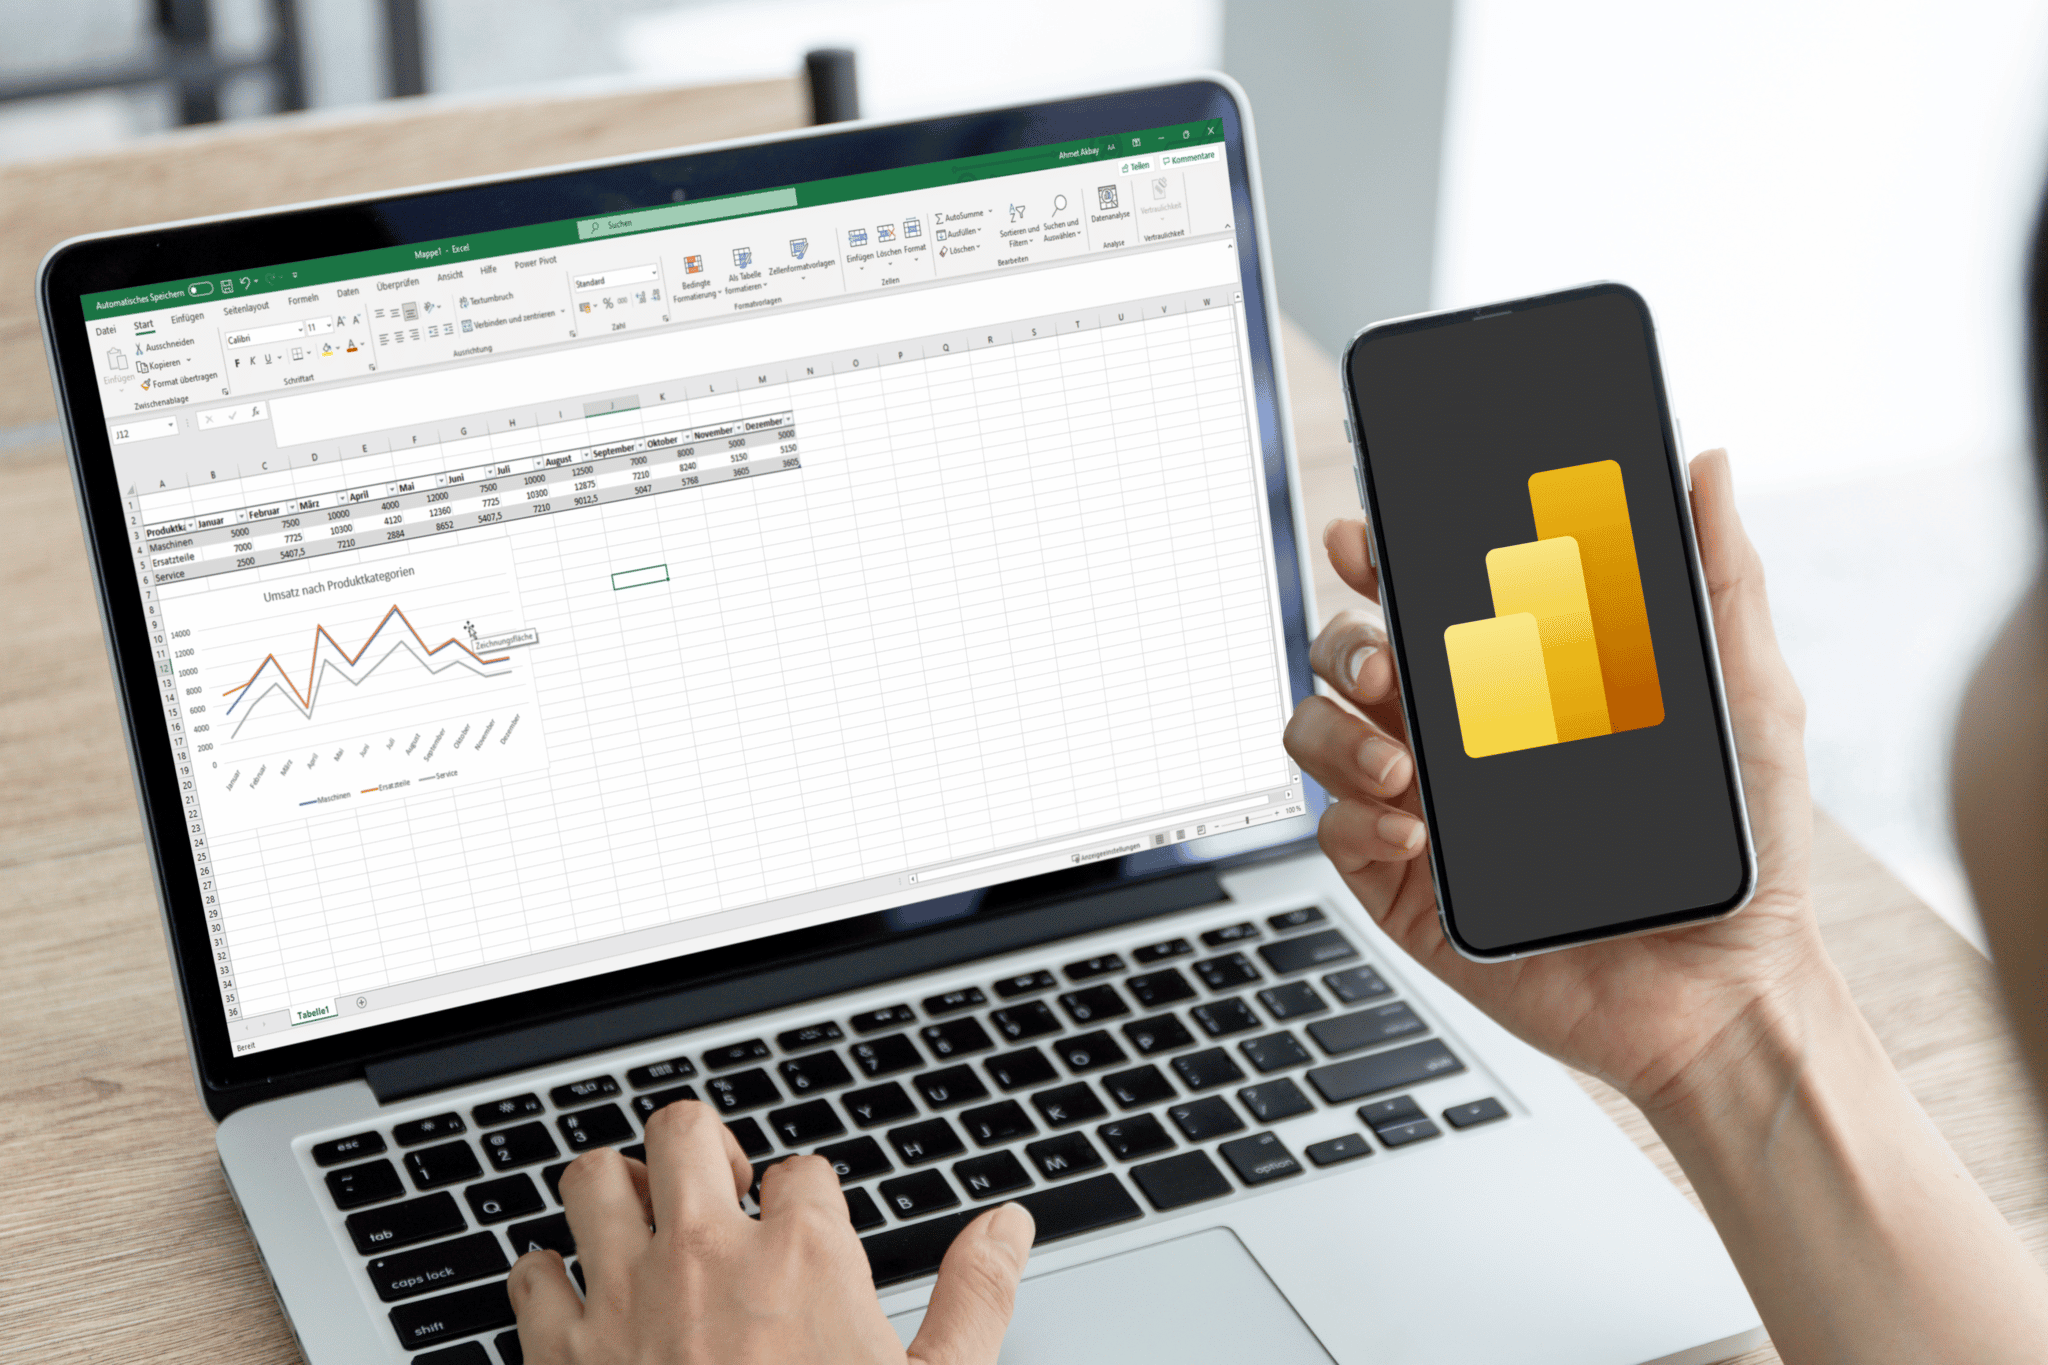
How to work with Microsoft Excel
Monday, 08:00 a.m.
Tony Stark, Head of Workforce Machinery, needs his sales team’s weekly analysis of sales figures as well as deviations from the past weeks/months. The sales meeting was postponed at short notice and therefore he needs the data much earlier than expected and turns to the responsible data analyst.
The evaluations are prepared by Pepper Potts, the sales data analyst. On a weekly basis, she is responsible for data acquisition and is a true SAP expert.
To do this, it must regularly call up the SAP transactions it is familiar with in order to export the required data. It searches for the predefined table layout and finds that this layout has already been overwritten by another colleague from data analysis. Pepper Potts quickly creates a new layout and exports the data to an Excel file. She then completes the newly downloaded data in her master Excel on the “Data” tab sheet. She immediately notices that her colleague has not only overwritten the layout variant, but also the formulas associated with it, and begins to revise them.
Before Pepper Potts can even begin the actual analysis of the data, 30 minutes passed and the sales manager has already written the first impatient e-mail about when he can expect the evaluation, since he has to present the analyses at 9:00 a.m. in the sales meeting and also needs time to view the key figures in advance.
Once in the analysis tab, Pepper Potts first has to copy the formulas from the previous month and copy them into the columns of the current month. But again, errors were caused by the different layout. In addition, it found an inconsistency in the data audit . After a 20-minute search for the reason for the discrepancy, Pepper Potts notices that some material numbers are not yet present in the analysis tab and adds them manually.
Do you also see parallels to your work?
Then finally stop to “Exceln” and start to “Power BIen”
But what is Power BI?
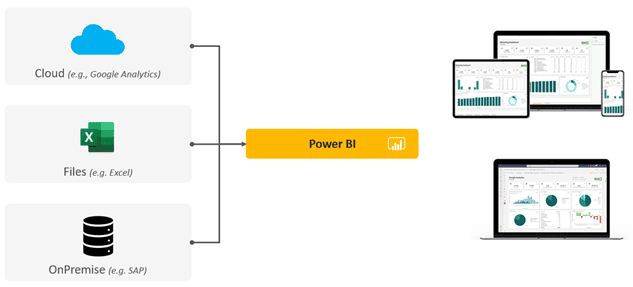
Microsoft Power BI is a cloud-based business intelligence technology that provides real-time analysis of data using visualizations and tables. It essentially consists of two components.
Which data sources can be connected?
Power BI offers numerous connectors to extract data from different sources. Be it a web or cloud connection such as Google Analytics or a SQL database, but also Excel files can be easily imported into Power BI. With the SAP data extractorfromTheobald Software, it is very easy to access on-premise software such as SAP ECC or S/4HANA and to create reports automatically. Once predefined, the report is updated up to eight times a day for a Power BI Pro account.

What added value do the Power BI features offer you?
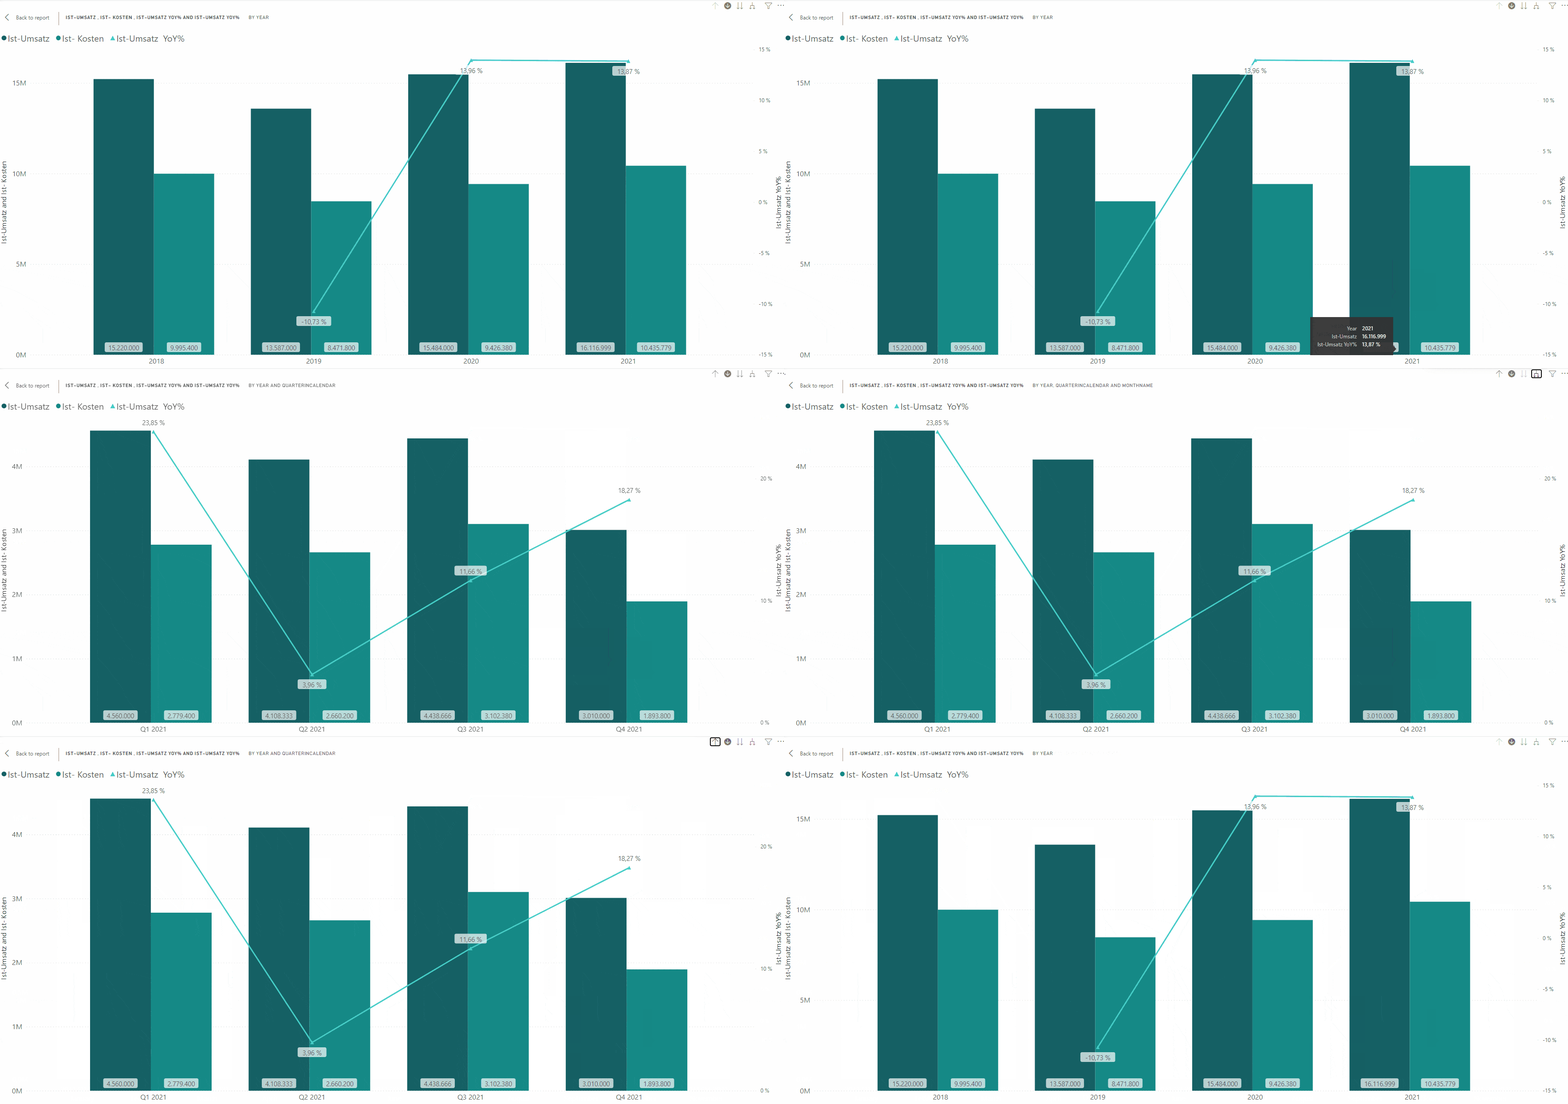
With Microsoft Power BI, you can effortlessly analyze data from any perspective. By “clicking” on elements in the dashboard, you can view detailed information and see correlations with other data.
With so-called drill-downs, a hierarchical level can go deeper into a visual element and draw new insights from your data . With drill-through pages, you can generate additional subpages and further insights very quickly and easily.

What can working with Power BI look like?
Monday, 8:30 a.m.
Already on the train, department head Tony Stark takes a look at the report on his tablet. With the automatic refresh, he always has the latest data. With filtering options and the Q&A function, he can analyze the data in much more detail and understand correlations. In the event of unexpected key figures/deviations, the department head is thus able to quickly take possible measures . The highly qualified employee Pepper Potts, who has already been able to explain some deviations to the superiors with a comment, is no longer concerned with pure data preparation and troubleshooting, but now provides advice on possible measures.
The department head, who can have a coffee after arrival, is well prepared for the management meeting and can base his decisions with data.
With Microsoft Power BI , you not only have the ability to evaluate your data to make fact-based decisions, but you are also able to make your processes more efficient.
Sounds exciting?
We, the itmX Enterprise Intelligence Team, see ourselves as process experts mainly in the areas of marketing (analytics), sales (analytics), service (analytics) and commerce (analytics) with a strong technological understanding in the worlds of Microsoft and SAP. For most of our customers, SAP ECC or S/4HANA is the starting point for their considerations, because this is where all relevant company data is usually stored.
If you need more information about Microsoft Power BI, data integration with SAP, marketing tools such as Google Analytics or process optimizations along your customer journey, please feel free to contact me without obligation.
We’re here to help.
About the author


