Are you still excelling or are you already Power BI’ing? – Part 3
This is the third article in our blog series on the topic of data analysis and KPIs in the areas of marketing, sales, service and commerce using Microsoft Power BI. The data source SAP will also be an important part of this. Join us on a journey through the Power BI cosmos from first insights into existing tools to a more intensive look at use cases.
Are you still exceling or are you already Power BIing? Click here for Part 1 and Part 2 of the blog post series.

Do you remember Tony Stark and Pepper Potts – the characters from our first and second blog posts?
Pepper Potts, Head of Business Intelligence at Workforce Machinery, leads a team of data engineers, analysts and project managers. She is a champion of the data culture and is helping to evolve the company into a Data-Driven Company. Her team is not only responsible for data engineering, data modeling and data visualization, but is also instrumental in ensuring that users are using Power BI correctly. With training courses, she wants to ensure that users do not have to approach the BI department for every requirement, but can become active themselves.
Self Service Approach with Excel vs. Power BI
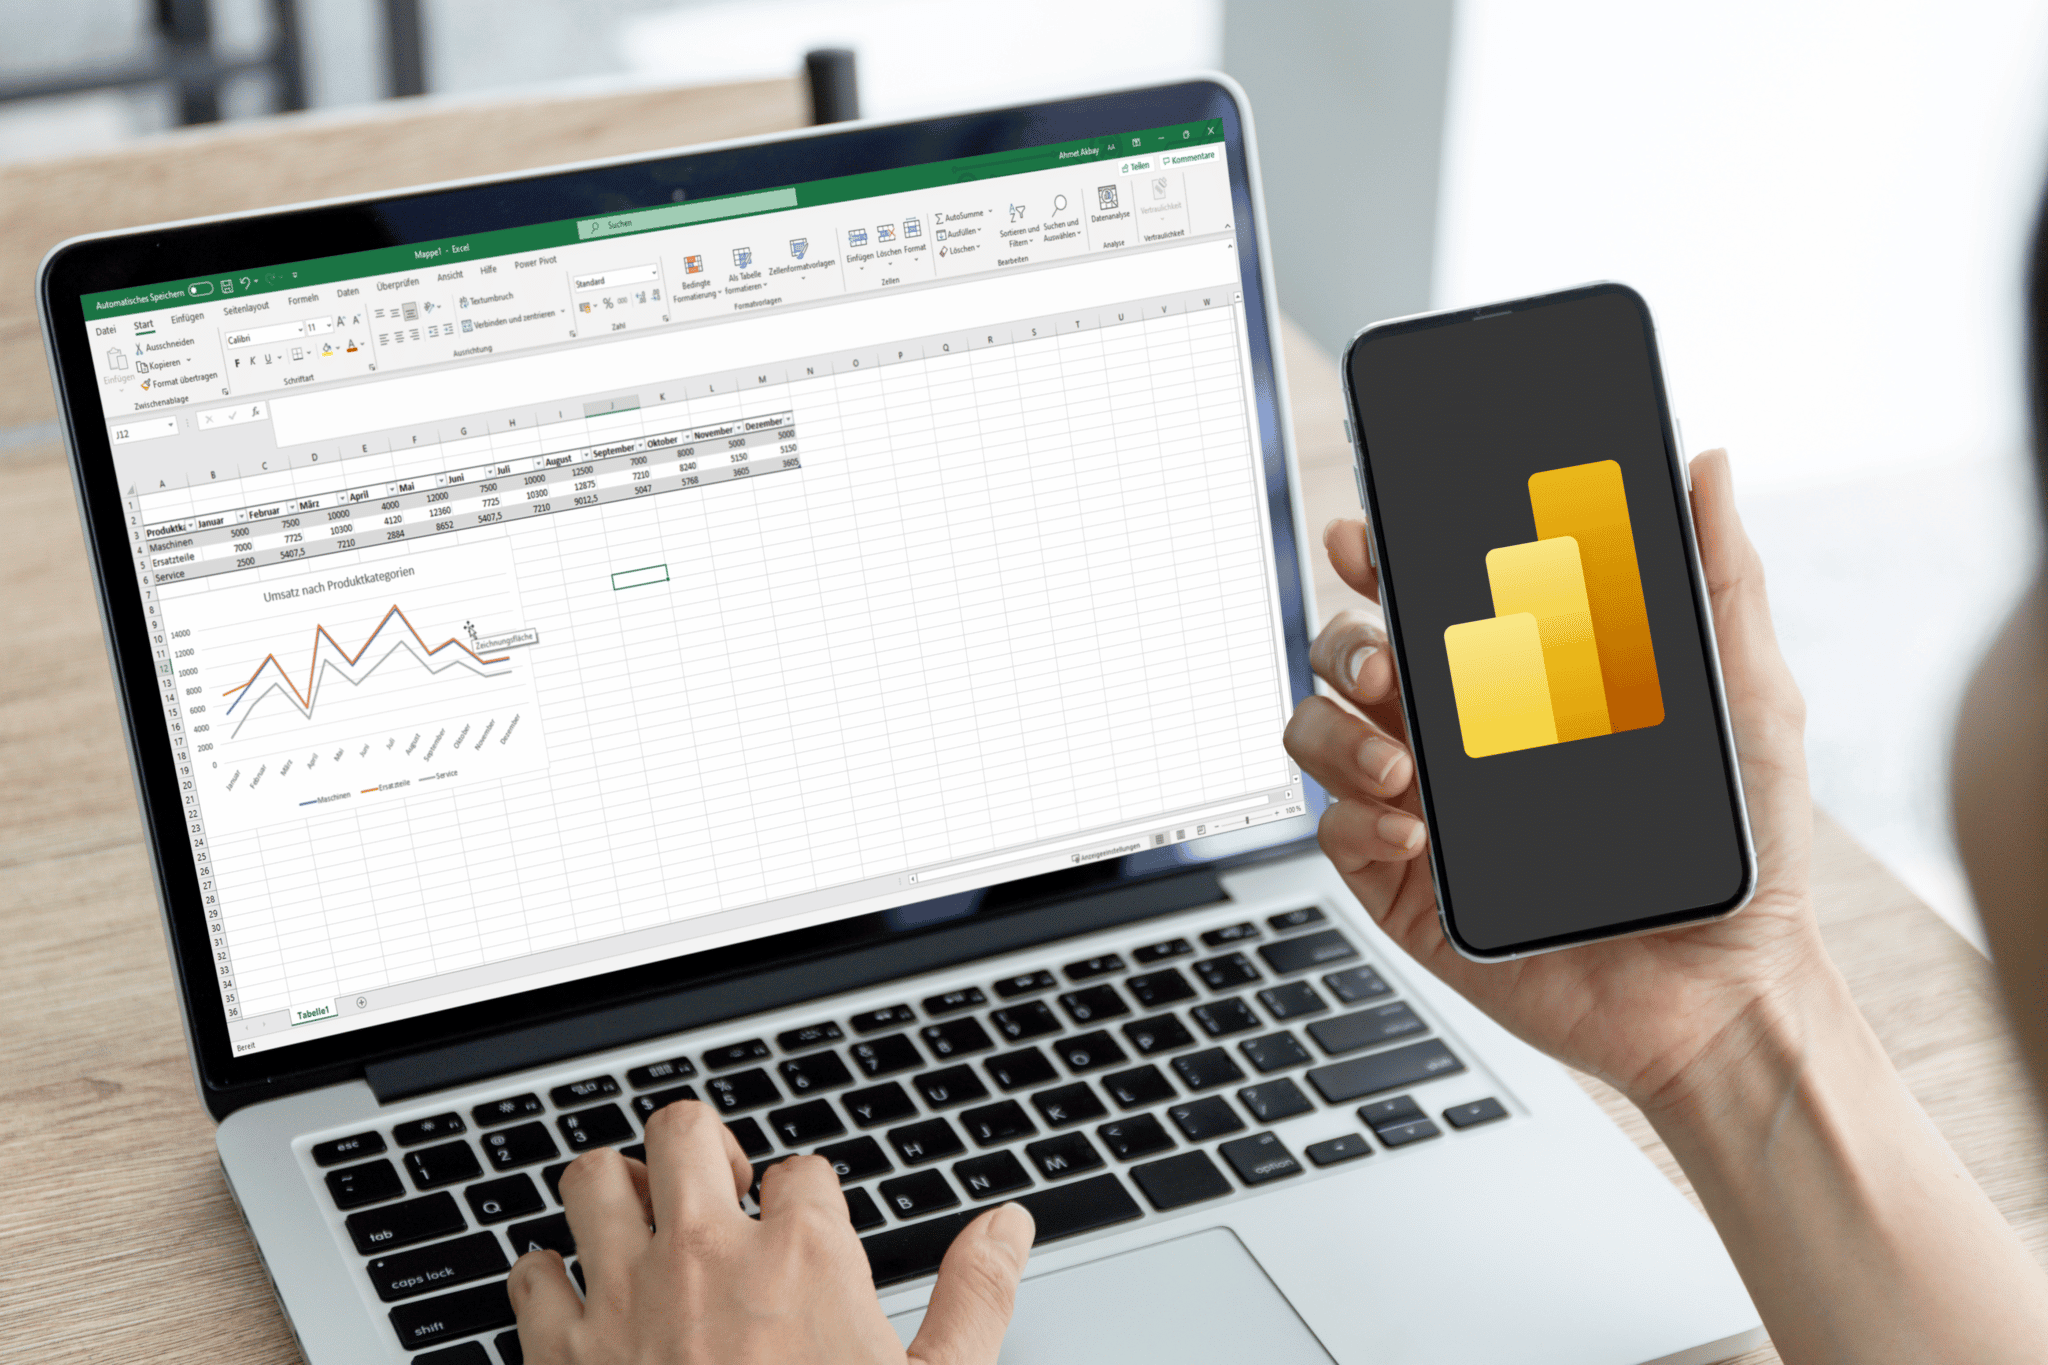
Tony Stark, now in the management of Workforce Machinery, always has new requirements for his analyses and evaluations and has to spend a lot of time preparing and visualizing his Excel-based reports. For simple adjustments to existing reports, Tony Stark is able to make ad hoc adjustments in Excel himself. But for more complex issues, he often has to call in colleagues from the “former” controlling department so that they can then prepare an analysis for him. The process looks like this: He has to explain his requirements to the data analyst every time, the analyst has to understand the requirements and implement them afterwards. With new analysis requirements, this process starts anew.
But what does the self-service approach look like with Power BI?
First of all, there must be no illusion that a BI tool can fulfill all requirements at the push of a button or that new requirements can be implemented automatically. Here, too, it is important to define the requirements in advance. Power BI is particularly worthwhile when standardized analyses and reports are required, such as a performance tracker that shows the current target achievement of individual persons or sales departments, or the presentation of year-over-year comparisons of incoming orders and sales potential.
A BI tool, such as Microsoft Power BI, however, offers users some additional analysis options within a completed report that enable a certain level of self-service. The easiest way to do this would be to use filter functionalities, drill down or drill through capabilities within a report. But also through other visualizations and functions self service possibilities can be provided in Power BI.
ToolTip
It is possible using Power BI Desktop and the Power BI service to create engaging report tooltips that are displayed when you hover the mouse cursor over visual elements. An example of this would be a report with a world map showing sales in the current year in different colors. By using ToolTips, one can display additional information such as sales over the years. In addition, functions such as Drill Through and Drill Down can be used to break down evaluations to a more detailed level.
Another benefit is the analysis of data from the Power BI Service in Excel. Data tables and visualizations can be exported directly from the Power BI service to Excel or data from the data set can be imported into Excel.
In summary, Microsoft Power BI provides users with a comprehensive set of options to analyze data on their own. However, it is important to plan and use these self-service features carefully.
With Microsoft Power BI, you not only have the ability to analyze your data to make fact-based decisions, but you are also able to make your processes more efficient.
We, the itmX Business Intelligence team, see ourselves as process and analytics experts with a focus on the areas of marketing, sales, service and commerce with a strong technological understanding in the worlds of Microsoft and SAP. SAP ERP ECC, S/4HANA or SAP BW is the starting point for most of our customers, as this is where all relevant company data is usually located. However, additional data sources, such as web-based additional tools, SQL servers, SharePoint lists or even simple flat files (.xml, .json, .csv) are also part of our daily work.
Sounds interesting?
We, the itmX Business Intelligence Team, see ourselves as process experts mainly in the areas of marketing (analytics), sales (analytics), service (analytics) and commerce (analytics) with a strong technological understanding in the worlds of Microsoft and SAP. SAP ECC, S/4HANA or SAP BW is the starting point for most of our customers, as this is where all relevant company data is usually located.
If you need more information about Microsoft Power BI, data integration with SAP, marketing tools such as Google Analytics or process optimization along your customer journey, please contact me.
We will be happy to help you.
About the author
About the author


